This content originally appeared on HackerNoon and was authored by Instancing
Table of Links
Results
Discussion
4. Discussion
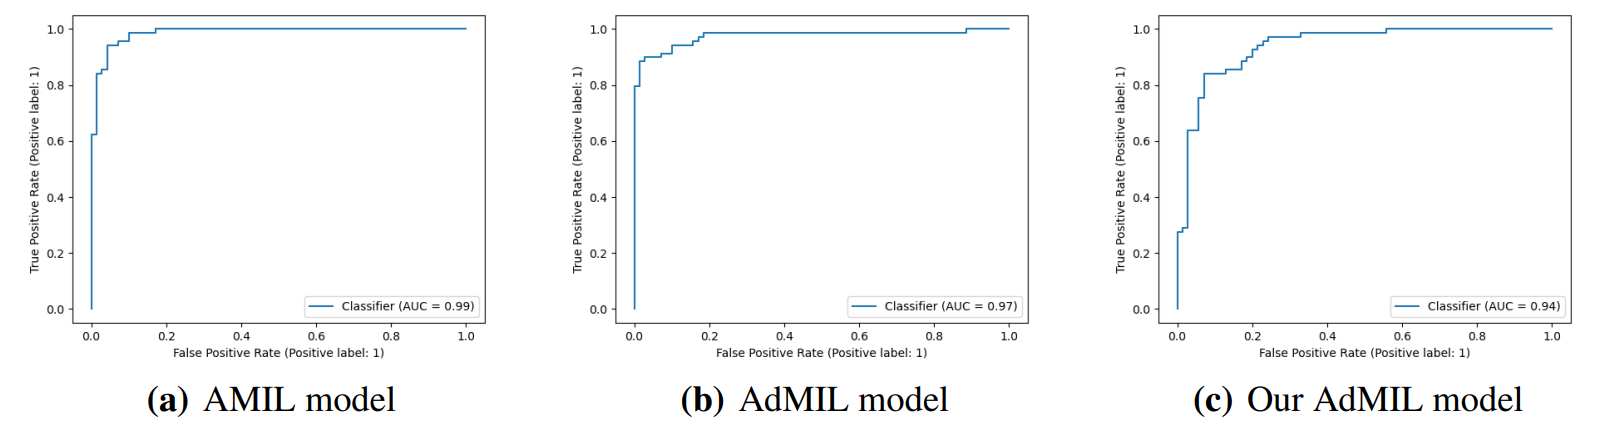
4.1. Tumor Detection Task
The models performed on par with the state-of-the-art for this task, in terms of their ability to correctly classify WSI, with AUC values above 0.9 (Table 1). The original article [7] used two H&E image datasets: the breast cancer dataset and the colon cancer dataset. Comparing our results with the ones reported in this work, we obtained significantly better results than the first and similar results to the second. We should note however that these datasets are not only
\
\
\
\
\
\
\
\ from a different cancer type but also composed of patches as bags, instead of slides. Other works used the AMIL architecture and its own variations with datasets composed of tiles at higher magnifications [11, 20]. In general, we obtained a better AUC than previous reported work, which supports the fact that 5x magnification might be adequate for identifying tumors.
\ Considering that the dataset we used only had flash-frozen slides, that it presented some artifacts, and that it included varied percentages of tumors, we can assume that the models learned to differentiate unrelated factors from the tumors present in the images. Moreover, these results were obtained from tiles at 5x magnification, a level that displays tissue but not cells. This supports the hypothesis that, just like pathologists, models can learn to identify tumor slides at the tissue level. It also reveals that the task in itself might not be challenging enough, and exploring higher magnifications will not meaningfully improve the slides’ classification ability. It was due to these results and the fact that this is the most common level used for tumor detection by pathologists that we did not explore further magnification levels for this task.
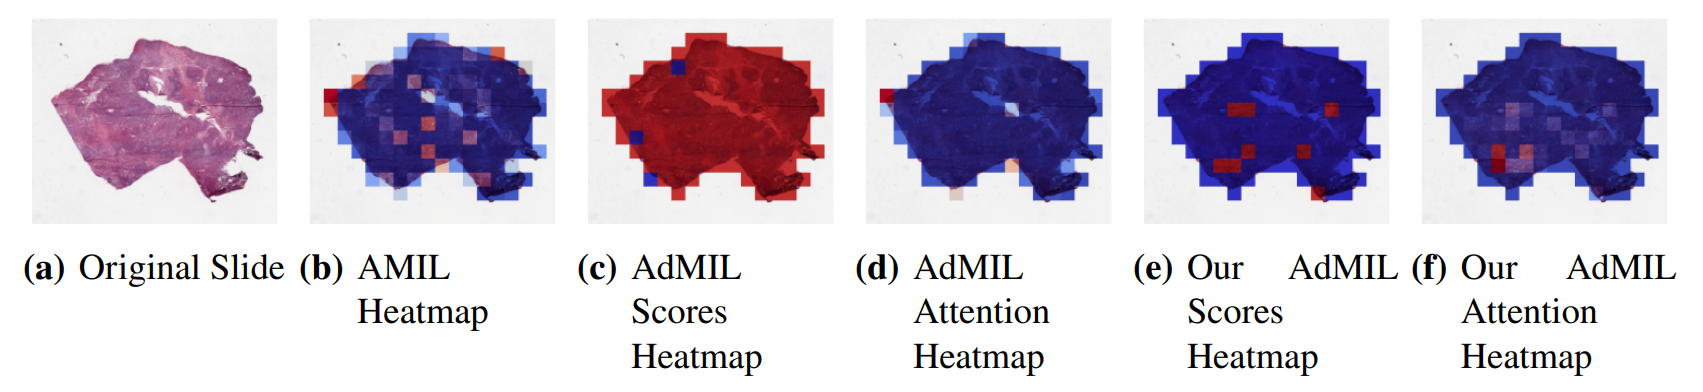
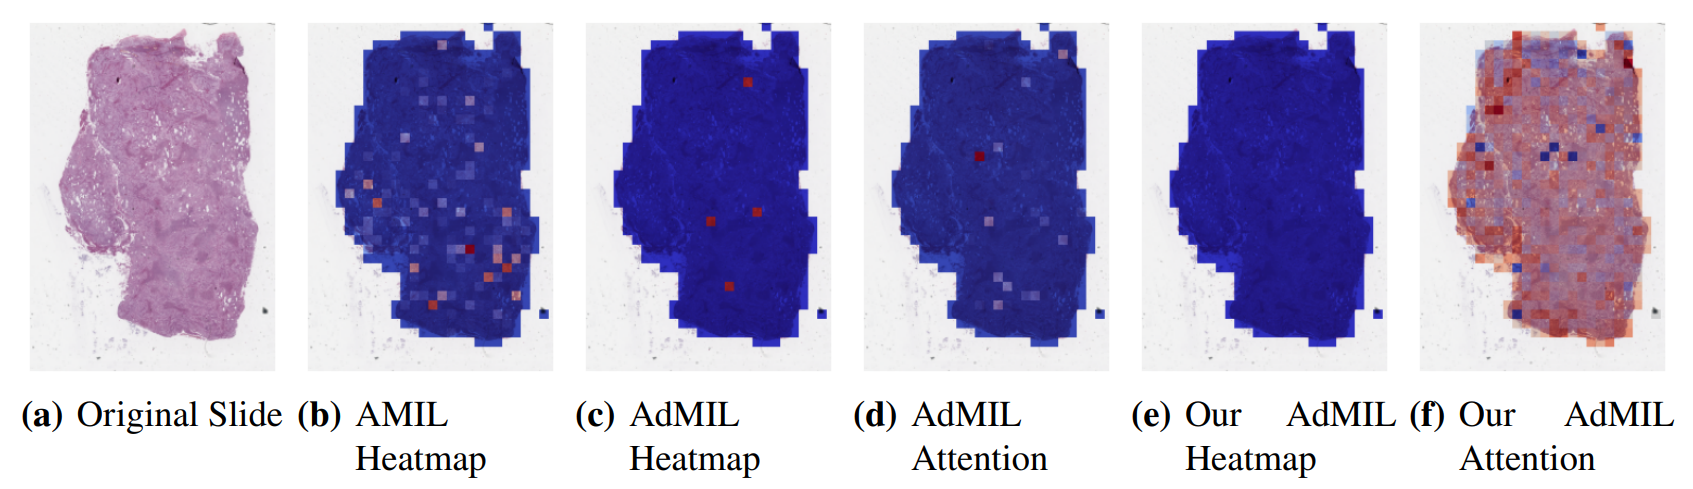
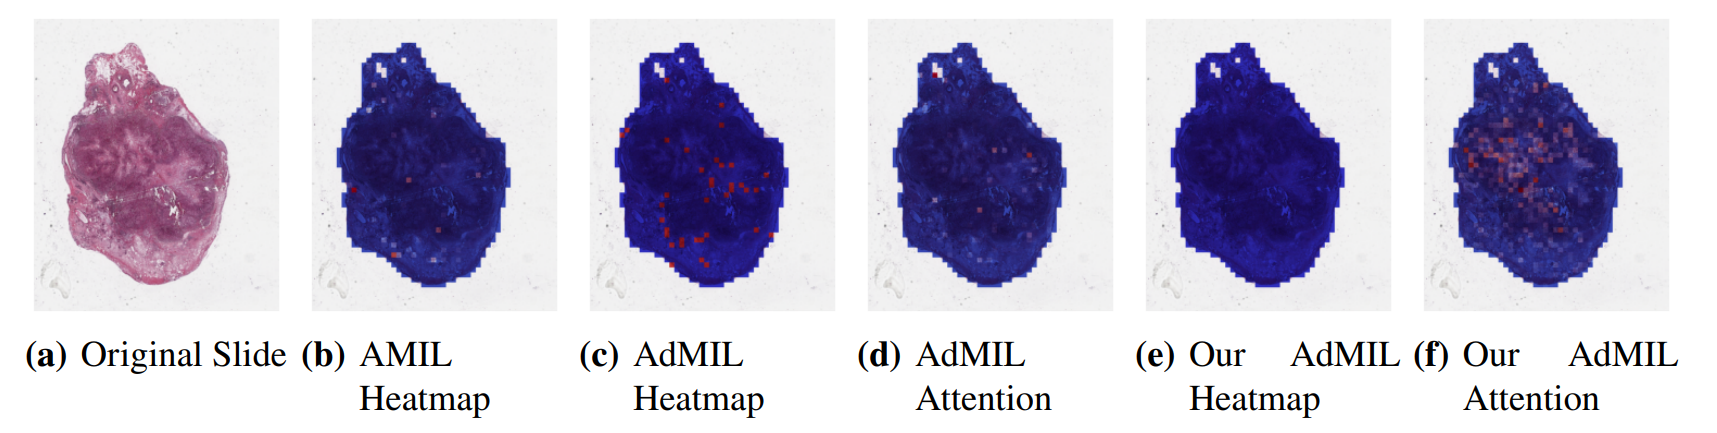
\ By analyzing the attention scores produced, we observed that both the AMIL Architecture (Figure7(b)) and our version of the AdMIL model (Figure 7(f)) produce sparser attention scores when compared with the original AdMIL (Figure7(d)) as we previously predicted. This behavior might be especially important if the tumor regions (or the desired RoIs) appear more scattered. On the other hand, for morphologies that are usually more focused on a specific patch, the attention layer from the original AdMIL could be preferable.
\ On the other hand, when analyzing the excitatory/inhibitory scores produced by the Additive MIL framework, the scores produced by the original AdMIL model tend to be positive for most of the patches (Figure7(c)), while the ones produced by our version of AdMIL only highlight a small portion (Figure7(e)). This behavior was observed for most of the slides. Since the only difference in the models’ architecture is their attention layers, we conclude that sparser attention scores tend to make the instance classifier consider only a small subset of patches as excitatory. Depending on the results acquired from a future evaluation of the heatmaps’ relevance, this might support the hypothesis that attention scores do not necessarily highlight the desired RoIs and might not be enough for meaningful WSI painting.
\ It is also interesting to notice that the AMIL attention scores tend to focus more on the edges of tissue (Figure 7(b)). This might mean that the tumor is present in the borders of the tissue, but it might also reveal some bias in the model for patches that include some percentage of background. Due to the magnification used, and the fractures that appear in flash-frozen slides, there was a significant amount of patches that contained background, when compared to higher magnifications and it is possible that this conditioned the model’s learning ability.
\ Further evaluation of the RoI detection has to be done, especially a qualitative evaluation of the heatmaps obtained. We would need the help of pathologists to confirm that the patch scores that these models obtain are indicators of tumor regions. Furthermore, while the AMIL model showed a slightly better AUC than the other models, this does not necessarily mean that its heatmaps are more relevant or helpful for pathologists. The patch scores obtained from the other two models, due to their inhibitory/excitatory nature, might provide greater insight into tumor presence in the slides. Due to time constraints and the non-existence of ground truth heatmaps, this evaluation is left as future work.
\
:::info Authors:
(1) Martim Afonso, Instituto Superior Técnico, Universidade de Lisboa, Av. Rovisco Pais, Lisbon, 1049-001, Portugal;
(2) Praphulla M.S. Bhawsar, Division of Cancer Epidemiology and Genetics, National Cancer Institute, National Institutes of Health, Bethesda, 20850, Maryland, USA;
(3) Monjoy Saha, Division of Cancer Epidemiology and Genetics, National Cancer Institute, National Institutes of Health, Bethesda, 20850, Maryland, USA;
(4) Jonas S. Almeida, Division of Cancer Epidemiology and Genetics, National Cancer Institute, National Institutes of Health, Bethesda, 20850, Maryland, USA;
(5) Arlindo L. Oliveira, Instituto Superior Técnico, Universidade de Lisboa, Av. Rovisco Pais, Lisbon, 1049-001, Portugal and INESC-ID, R. Alves Redol 9, Lisbon, 1000-029, Portugal.
:::
:::info This paper is available on arxiv under CC by 4.0 Deed (Attribution 4.0 International) license.
:::
\
This content originally appeared on HackerNoon and was authored by Instancing