This content originally appeared on Angular Blog – Medium and was authored by Angular
Authors: Mark Thompson Pawel Kozlowski
Profiling web applications can be a complex task, often requiring developers to juggle between different tools that present data in disconnected ways. Traditionally, Chrome’s performance panel is excellent for detailed function call analysis, while Angular DevTools offers a higher-level view based on framework concepts like components, lifecycle hooks, bindings etc. Unfortunately, having two separate tools leads to a fragmented understanding of performance.
This fragmentation presented a significant opportunity to improve the developer experience when profiling Angular applications. As a result, the Angular and Chrome teams have partnered to bring Angular-specific data and insights directly into the Chrome DevTools performance panel, creating a unified profiling experience. We’re excited to introduce the new custom track for Angular in Chrome DevTools.
This integration allows developers to combine the benefits of both tools, offering a more synchronized and comprehensive view of their application’s performance.
Getting to Know the New Custom Track
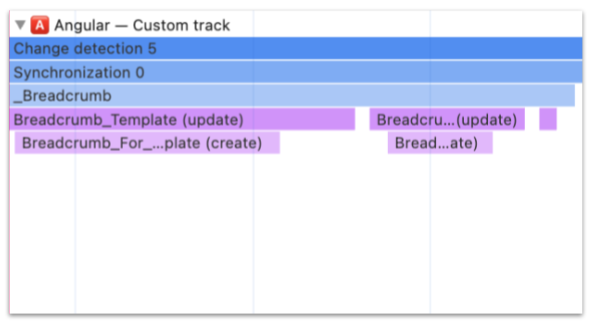
With this new integration, you’ll find performance data using Angular concepts, such as application bootstrap, components, UI synchronization, and lifecycle hooks:
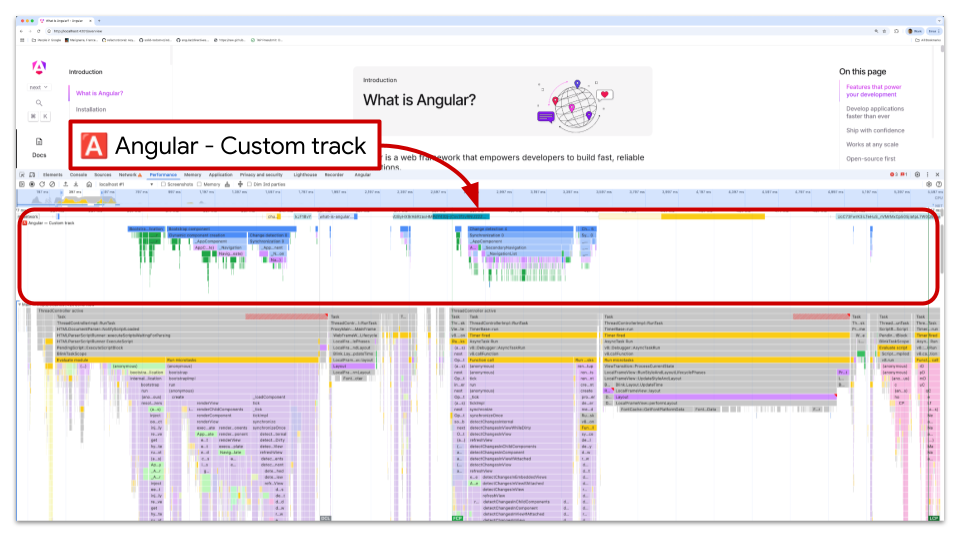
The custom track’s flame charts group function invocations together under corresponding components and other Angular concepts. You can drill down to individual functions for a more granular view when needed and still glean meaning from the groupings in other scenarios
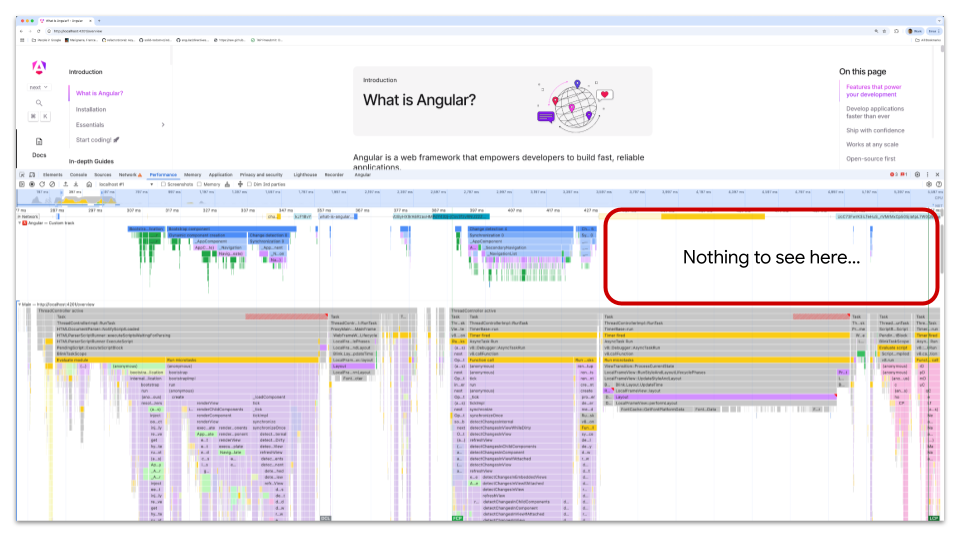
One of the most significant benefits is the ability to distinguish between your application’s code, other scripts, or browser activities like layout and paint.
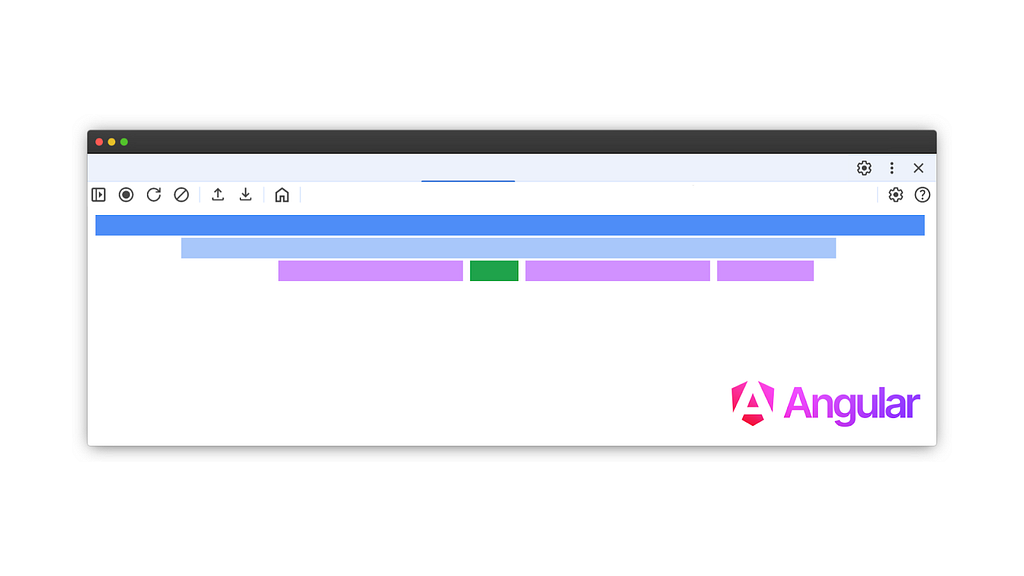
Decoding the Colors: What Your Code is Doing
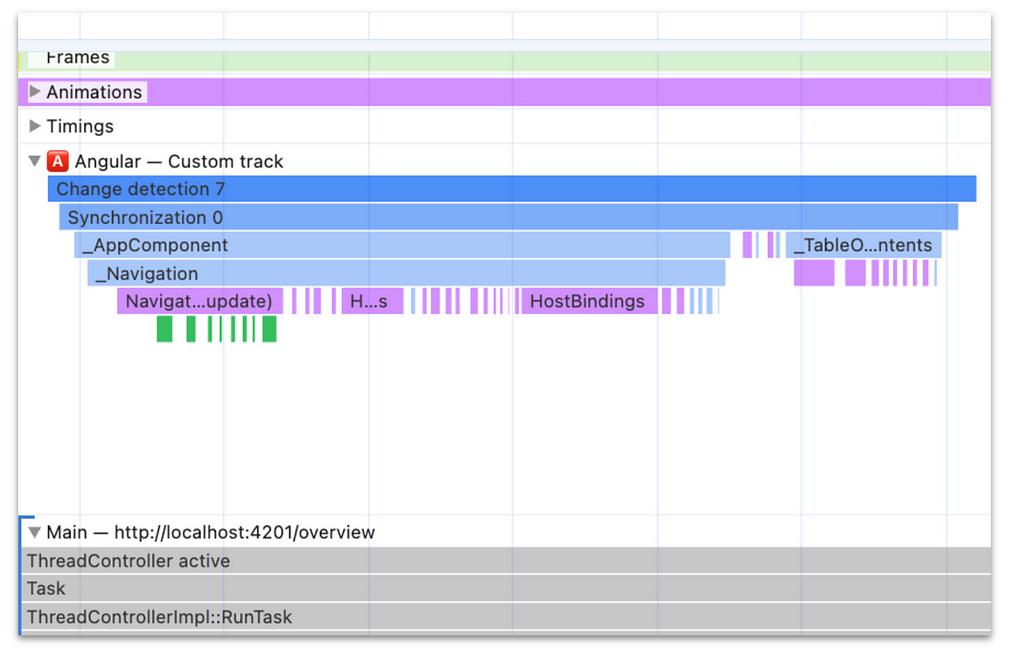
The flame chart entries are color coded to help you quickly identify what’s happening in your application.
- Green Bars: These represent Dependency Injection (DI) services instantiated during the application bootstrap process. In general, green signifies the execution of code written by application developers.
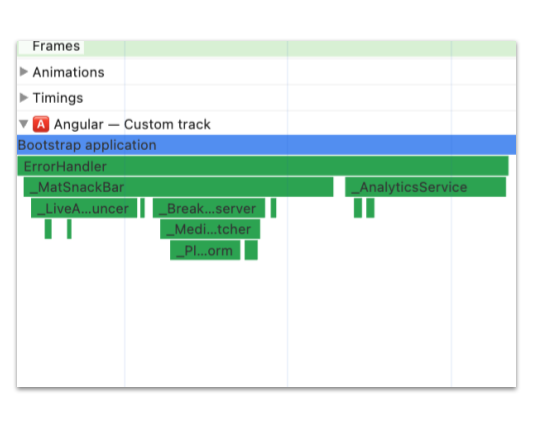
- Purple Color: This color is reserved for templates compiled by Angular. Even though it’s still your code, it has been transformed by Angular before execution in the browser. This allows you to clearly see which templates are creating or updating the DOM and how long these operations take.
- Various Shades of Blue: These mark the entry points. At the very top, you’ll see the trigger — why Angular decided to run application code. Subsequent blue bars represent all the components that need to perform work, which is particularly useful for understanding how user interactions impact DOM updates. Below component names, you’ll find the familiar purple (templates) and green (your component code).
Since the custom track is interactive, clicking on an entry in the flame chart reveals more detailed information about a given entry. This data empowers developers to dive deeper into specific function calls and understand their impact on the application’s performance.
How to Get Started
Enabling this powerful new feature is straightforward. Complete the following steps:
- Ensure you are using the latest version of Angular (v20 at the time of this post) and an up-to-date version of the Google Chrome browser.
- Run your Angular application in developer mode.
- With your application running, open Chrome DevTools and enable the custom track by typing ng.enableProfiling() in the console.
- Once enabled, start recording a performance profile. The dedicated “Angular” track in the flame chart will be available.
Check out the Angular documentation for more details on configuration and setup.
More Performant Apps are on the Way
This new integration with Chrome DevTools demonstrates our ongoing commitment to improving the developer experience within the Angular ecosystem. By providing tools that offer more focused and actionable insights, the Angular and Chrome teams are empowering developers to build faster, more efficient applications. Please try out this new integration and let us know what you think.
The Angular Custom Profiling Track is now available was originally published in Angular Blog on Medium, where people are continuing the conversation by highlighting and responding to this story.
This content originally appeared on Angular Blog – Medium and was authored by Angular