It’s no secret that U.S. electricity prices have been rising over the last few years: The average residential energy bill in 2025 was roughly 30 percent higher than in 2021. This jump is largely in line with the overall inflation Americans have experienced during this period. As the cost of groceries, gas, and housing has increased, so too has the cost of electricity.
But there are big differences from state to state and region to region. Some places — like California and the Northeast — have seen mammoth price increases that outpaced inflation, while costs have held steady in other parts of the country, or even fallen in relative terms. Nearly everywhere, though, rising electricity costs have strained the budgets of low-income households in particular, since they spend a much larger share of their earnings on energy compared to wealthier Americans.
Higher energy bills have also become a political flashpoint. Over the past year, rising electricity prices have helped push voters to the polls, and politicians have taken note. In Virginia and New Jersey, newly elected governors campaigned heavily on reining in utility bills. In Georgia, incumbent utility regulators were booted out by voters, who elected two Democrats to the positions for the first time in two decades.
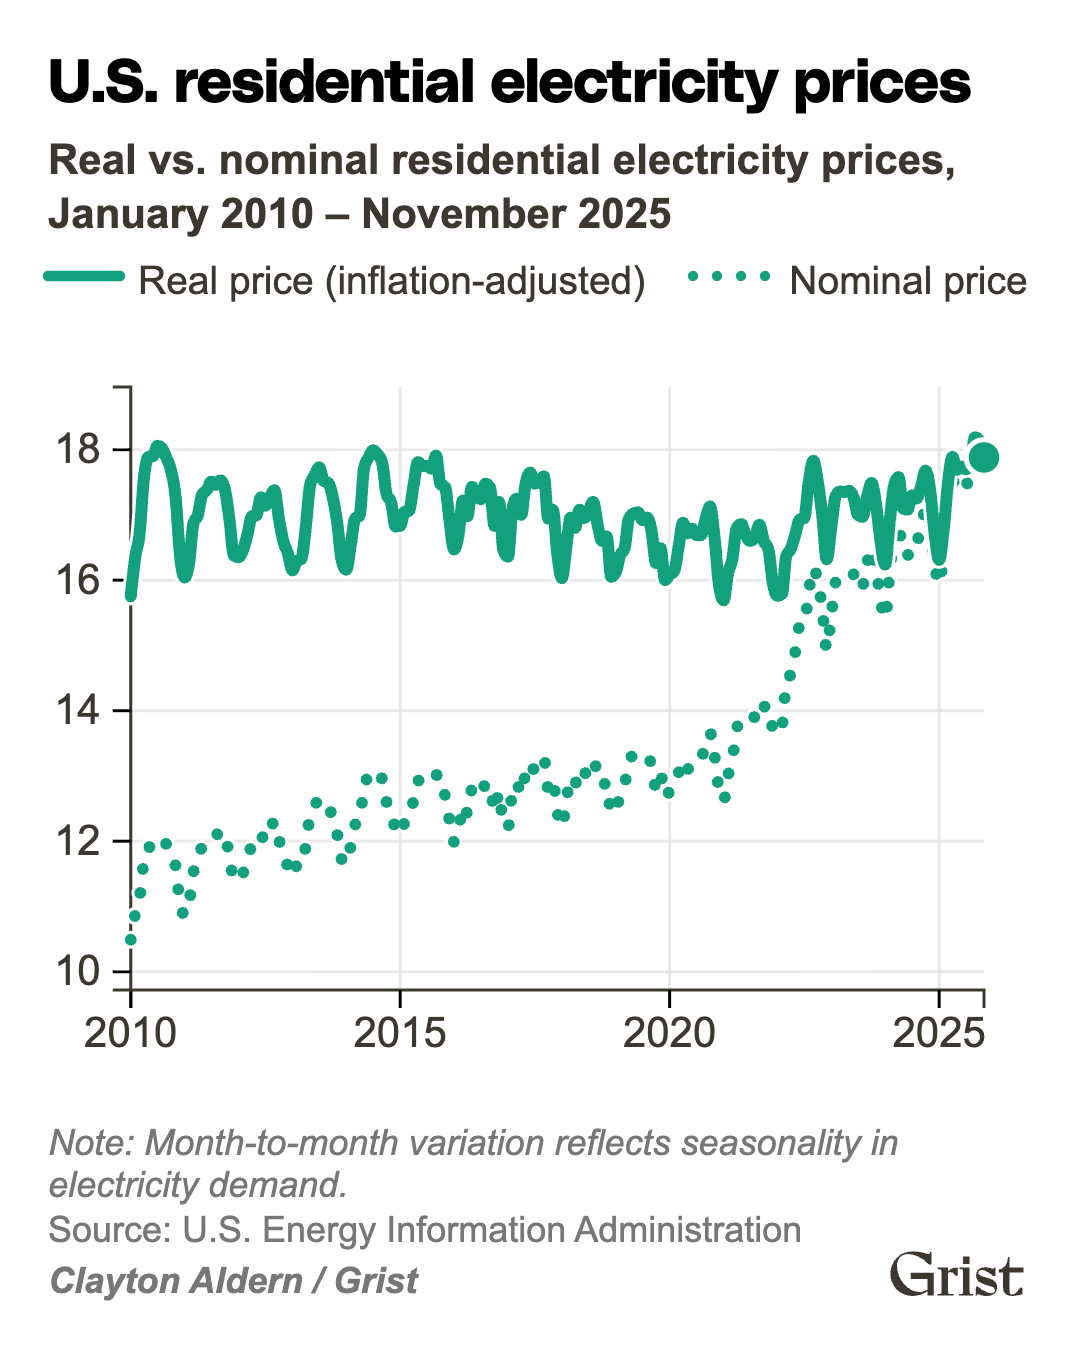
U.S. residential electricity prices
Real vs. nominal residential electricity prices, January 2010 – November 2025
A wide range of culprits have been blamed for the surge in electricity prices, with energy-hungry data centers shouldering much of the criticism. Tariffs, aging power plants, and renewable energy mandates have also come under fire. But the reality is far more nuanced, according to recent research from the Lawrence Berkeley National Laboratory and the latest price data from the federal government’s Energy Information Administration. Electricity prices are shaped by a complex mix of factors, including how utilities are structured, how regulators oversee them, regional divergences in fuel prices, and how often the grid is stressed by heat waves or cold snaps. In many states, the biggest driver is the rising cost of maintaining and upgrading grids to survive more extreme weather — the unglamorous work of replacing old poles and wires.
Select your state from the dropdown menu below. (U.S. territories, including Guam and Puerto Rico, do not appear in the menu, since data availability is more limited.)
Compare your state’s electricity prices to the U.S. average
Real and nominal prices, cents per kWh
Click to show or hide lines
But the forces driving high bills in California aren’t the same as those affecting households in Connecticut or Arizona. In this piece, we highlight one key driver of recent price trends in each region of the country. (The regions below are organized alphabetically, with individual entries for Alaska, California, Hawaiʻi, the Midwest, the Northeast, the Pacific Northwest, the Southeast/Mid-Atlantic, the Southwest/Mountain West, and Texas.) While the dynamics of every utility bill are different — including those within the same state — recent data demonstrates the many challenges ahead as public officials promise a laser focus on energy affordability.
Alaska
Key factor: Geographic isolation
Alaska’s electricity prices are among the highest in the country, largely because the state’s power grid operates in isolation. Unlike utilities in the lower 48 states, Alaska’s providers can’t import electricity from neighboring states or Canada when demand spikes or supply runs short. That isolation limits flexibility and drives up costs. Utilities also have to spread the expense of generating and transmitting power across a relatively small customer base. The state’s primary grid, known as the Railbelt, serves about 75 percent of Alaska’s population. Beyond it, more than 200 microgrids power rural communities, many of which rely heavily on diesel generators. These structural challenges contribute to electricity rates that are roughly 40 percent higher than the national average.
Electricity prices have been rising in the state over the past decade, even after adjusting for overall inflation. A study by researchers at the Alaska Center for Energy and Power found that residential rates for Railbelt customers increased by about 23 percent between 2011 and 2019. Rural customers saw a roughly 9 percent increase during the same period.
While more recent data charting electricity prices adjusted for inflation isn’t readily available, energy costs are likely to grow in the state. That’s because Alaska depends on natural gas for electricity generation and heating, and it relies on the Cook Inlet basin for natural gas. With supplies dwindling in that reserve, the state is expected to face a shortage soon. If it chooses to import natural gas, it will be much more easily affected by price swings in the natural gas market. State regulators have also approved a 7.4 percent interim rate increase for the Golden Valley Electric Association, the primary utility that serves the Fairbanks area. A full rate case review is underway, and a final decision on the rate will be made in early 2027.
California
Key factor: Wildfires
Californians have long paid above-average electricity prices. Since the 1980s, rates in the Golden State have typically been at least 10 percent higher than the national average. For decades, however, those higher per-kilowatt-hour prices were largely offset by lower electricity use as a result of the state’s relatively temperate climate. In other words, electricity in California cost more per unit, but residents consumed far less than households in many other states, keeping average monthly bills relatively low. That began to shift in the mid-2010s when the state began experiencing more frequent and larger wildfires. Since then, electricity prices have outpaced consumption, leading to exorbitantly high energy bills.
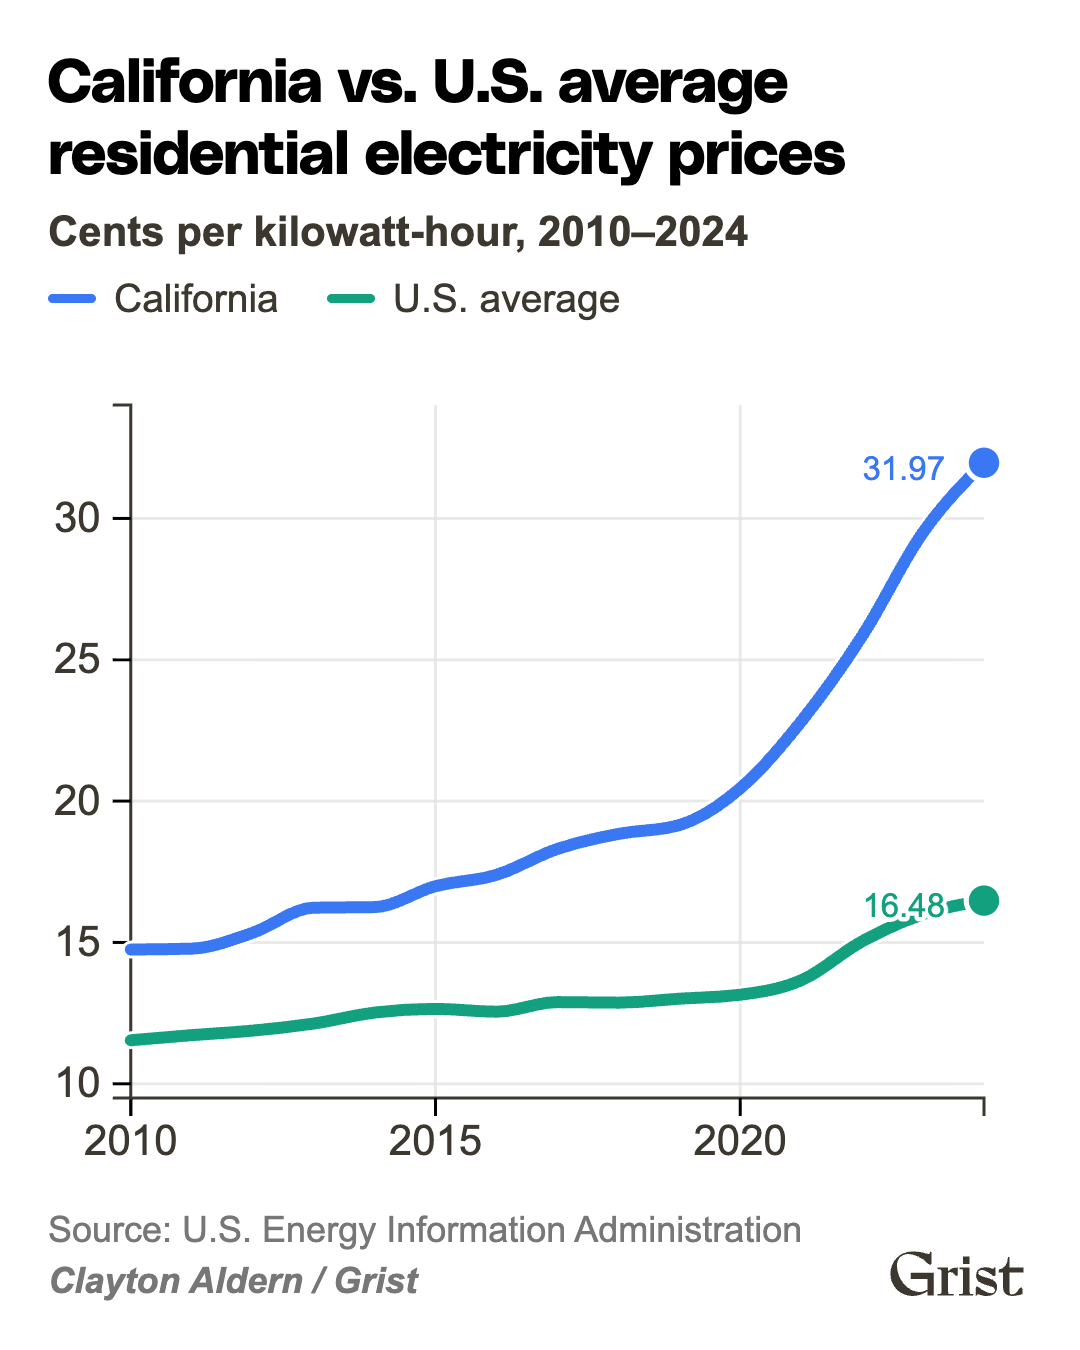
California vs. U.S. average residential electricity prices
Cents per kilowatt-hour, 2010–2024
Between 2019 and 2024, California had the largest increase in retail electricity prices of all U.S. states. Monthly energy bills in 2024 averaged $160, roughly 13 percent higher than the national average. Much of that increase has been driven by the soaring cost of infrastructure upgrades aimed at reducing wildfire risk, along with rising wildfire-related insurance and liability costs. After the 2018 Camp Fire, PG&E declared bankruptcy, citing $30 billion in estimated liabilities. Utilities have also poured billions of dollars into replacing aging transmission and distribution lines and expanding the grid to meet growing demand.
California’s high rate of rooftop solar adoption has also played a complicated role in rising prices. As more customers install rooftop solar, they purchase less electricity from the grid. That leaves utilities with the same fixed infrastructure costs — but fewer kilowatt-hours over which to spread them. The result: higher per-unit rates for customers who remain more dependent on grid power. Since renters and low-income Californians are less likely to benefit from residential solar, rising electricity rates hit them harder.
Hawaiʻi
Key factor: Oil dependence
Hawaiʻi has the highest electricity bills in the country. Average residential rates rose about 8 percent between 2019 and 2024, even after adjusting for overall inflation, and the typical household now pays more than $200 per month for electricity.
Those high costs are rooted in the state’s unique energy system. Hawaiʻi remains heavily dependent on oil to generate power, and many of its oil-fired plants are aging and relatively inefficient. That reliance ties electricity prices directly to global oil markets. Hawaiian Electric, the state’s primary utility, purchases crude oil on the open market and pays to have it refined before it is burned to produce electricity — meaning fluctuations in both crude prices and refining costs show up on customers’ bills.
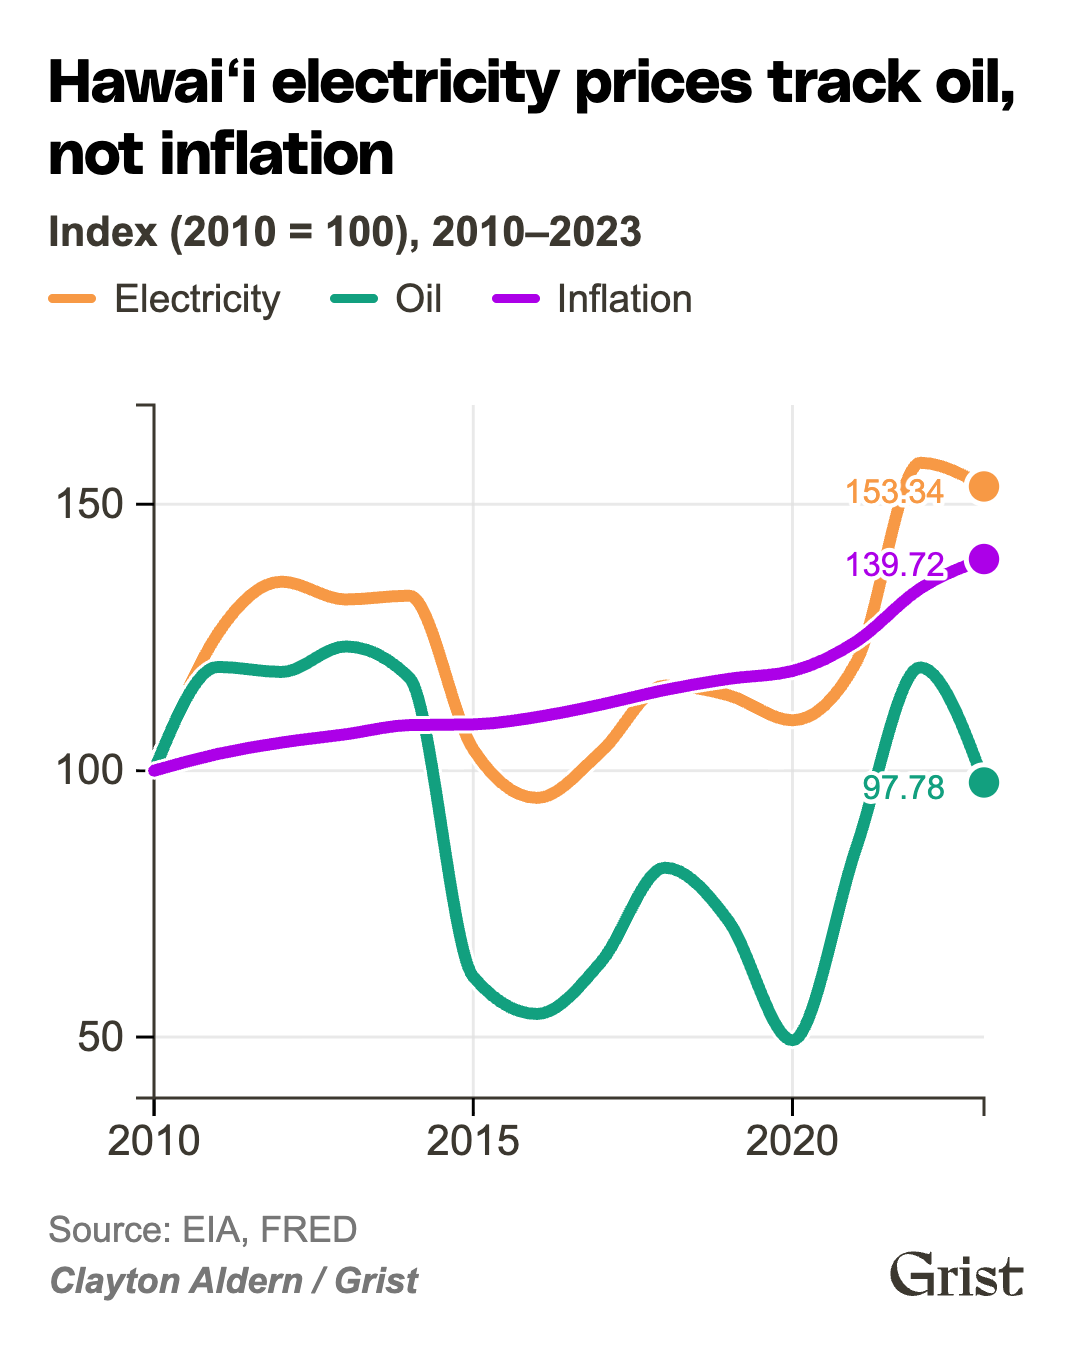
Hawaiʻi electricity prices track oil, not inflation
Index (2010 = 100), 2010–2023
While oil prices have eased in the past couple of years, they spiked sharply in 2022 following Russia’s invasion of Ukraine, driving up fuel costs and, in turn, electricity rates. Refining costs on the islands have also risen in recent years, adding further pressure to household bills. Fuel and equipment must also be shipped thousands of miles from the mainland — and often transported between islands — adding significant logistical costs. Hawaiʻi’s power grids are also small and isolated. Electricity generated on one island cannot easily be transmitted to another, limiting flexibility and preventing the kind of resource sharing common on the continental grid. Together, those structural constraints help keep electricity prices in Hawaiʻi persistently high.
Midwest
(Illinois, Indiana, Iowa, Kansas, Michigan, Minnesota, Missouri, North Dakota, Nebraska, Ohio, Oklahoma, South Dakota, and Wisconsin.)
Key factor: Wind energy
The Midwest and Great Plains states saw only modest changes — and sometimes even declines — in inflation-adjusted retail electricity prices per kilowatt-hour between 2019 and 2024. Average monthly electricity bills typically fall between $110 and $130.
This stability is largely a renewable energy success story: Many Midwestern states are now deeply reliant on wind power. Wind supplies more than 40 percent of electricity in Iowa and South Dakota, and more than 35 percent in Kansas. Investments in utility-scale wind and solar have helped shield consumers from price shocks tied to natural gas volatility, since renewables have no fuel costs and can reduce exposure to sudden spikes in gas prices. Research also shows that these investments can lower wholesale electricity prices by displacing higher-cost generation during periods of high wind and solar output.
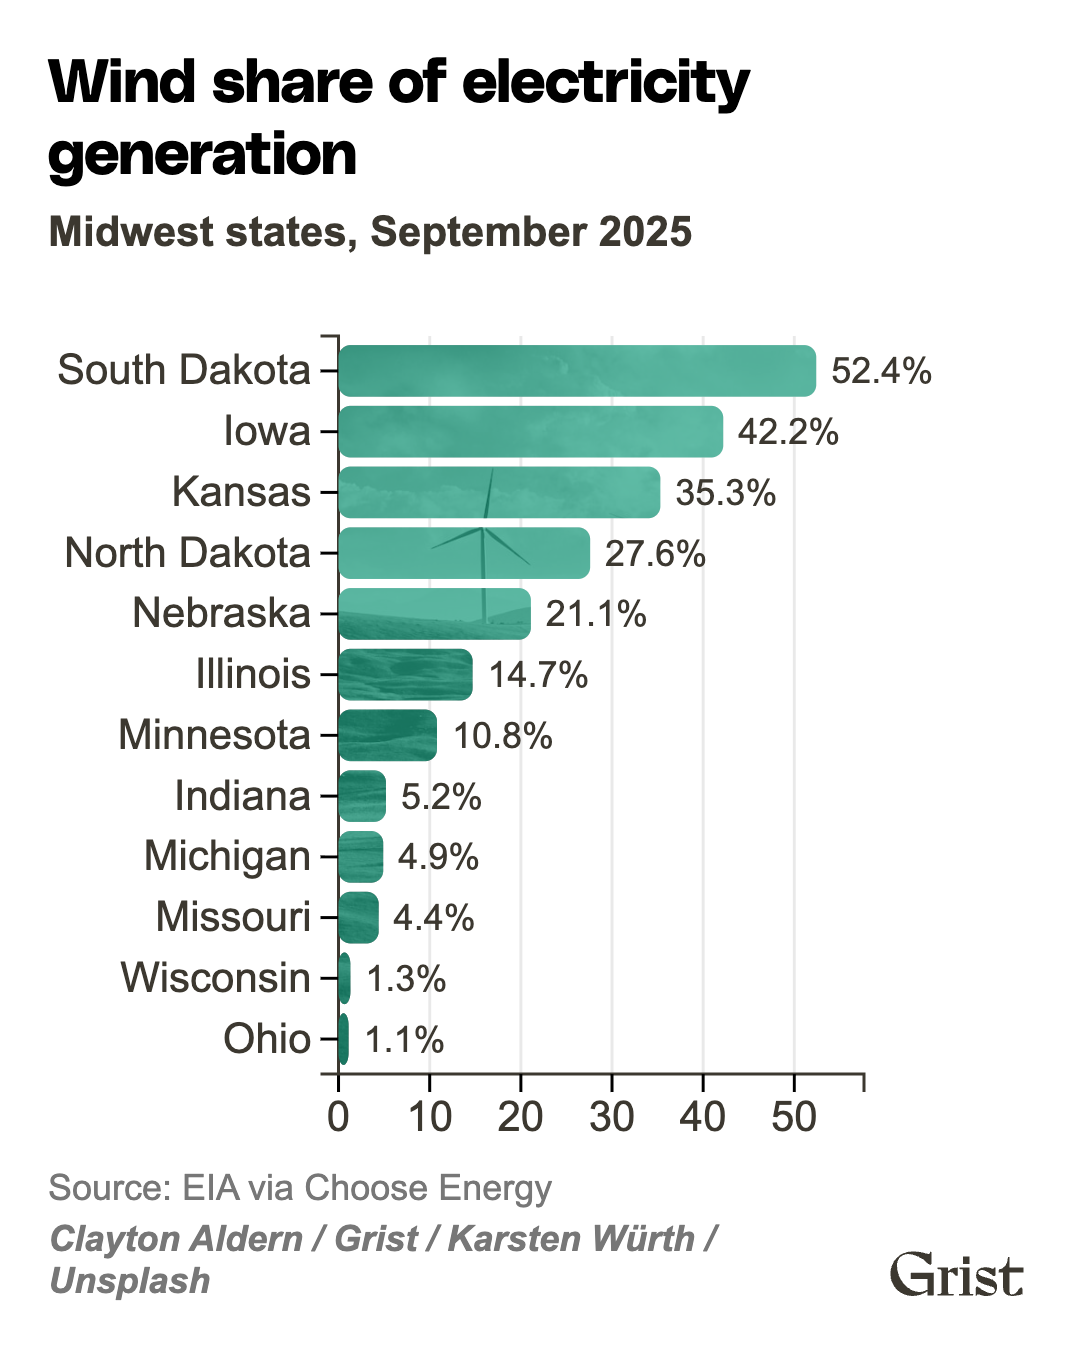
Wind share of electricity generation
Midwest states, September 2025
Northeast
(Connecticut, Maine, Massachusetts, New Hampshire, New Jersey, New York, Pennsylvania, Rhode Island, and Vermont)
Key factor: Natural gas prices
Aside from California and Hawaiʻi, northeastern states experienced some of the steepest increases in retail prices between 2019 and 2024. Prices in New York and Maine rose more than 10 percent over the last few years. Connecticut residents pay nearly $200 per month for electricity.
The region’s heavy reliance on natural gas as both a home heating fuel and a source of utility-scale electricity is a major driver of high energy bills, especially in winter. When temperatures drop, demand for natural gas surges as homes and businesses burn more fuel for heating. Power plants are then forced to compete with those heating needs for the same constrained supply. (Gas has to be transported to the region via pipelines that stretch as far as Texas.) With no easy way to bring in additional gas, prices spike, and those increases ripple through to power bills.
A combination of forces has worsened natural gas constraints in recent years, pushing electricity prices even higher, particularly during cold snaps. More households in the region are switching to heat pumps and buying EVs, driving up demand for power. International energy policies, like increasing U.S. exports of liquefied natural gas and the global gas crunch caused by Russia’s invasion of Ukraine, are driving up fuel costs stateside. Utilities in the Northeast, like those elsewhere in the country, are also pouring money into infrastructure upgrades, and those investments are being passed on to customers through higher bills.
Pacific Northwest
(Idaho, Montana, Oregon, Washington)
Key factor: Hydropower
Retail electricity prices in the Pacific Northwest rose only modestly over the last few years, at least compared to the country’s general rise in the cost of living. Inflation-adjusted prices in Washington and Oregon increased by about 5 percent between 2019 and 2024, while Idaho and Montana saw slight declines. In 2024, average monthly energy bills across the four states ranged from about $105 to $130, roughly in line with the national average. (This is not to say that customers haven’t noticed growing totals on their energy bills; the Energy Information Administration estimated that Oregon’s average retail price increased by 30 percent between 2020 and 2024, which is roughly in line with overall inflation over the last several years.)
So why has the region been largely insulated from the inflation-adjusted cost spikes that have struck neighboring areas like California? Hydropower. Abundant, low-cost hydroelectric generation has long kept energy bills in the Pacific Northwest — and the climate impact of the region’s power generation — among the lowest in the country. And while utilities in these states are facing rising costs tied to wildfire mitigation and infrastructure upgrades, cheap and plentiful hydropower has so far helped offset those increases.
Southeast and Mid-Atlantic
(Alabama, Arkansas, Delaware, Florida, Georgia, Kentucky, Louisiana, Maryland, Mississippi, North Carolina, South Carolina, Tennessee, Virginia, and West Virginia)
Key factor: Extreme Weather
Southeastern states frequently face hurricanes, flooding, and extreme heat. In recent years, the number of billion-dollar disasters in the region has increased, an ominous sign of the havoc that climate change will wreak. Utilities are fronting the costs of both weathering these events and rebuilding in their aftermath — and then they pass them on to their customers.
The cost of distributing electricity — think the power lines that deliver energy to your home — rose significantly in the Southeast over the past few years, driven mostly by capital expenditures to upgrade and build new infrastructure. In Florida, for instance, damage from Hurricanes Debby, Helene, and Milton in 2024 resulted in residential price increases from 9 to 25 percent the following year. Similarly, Entergy Louisiana’s plan to harden its grid costs a whopping $1.9 billion, much of which will be borne by customers through rate increases.
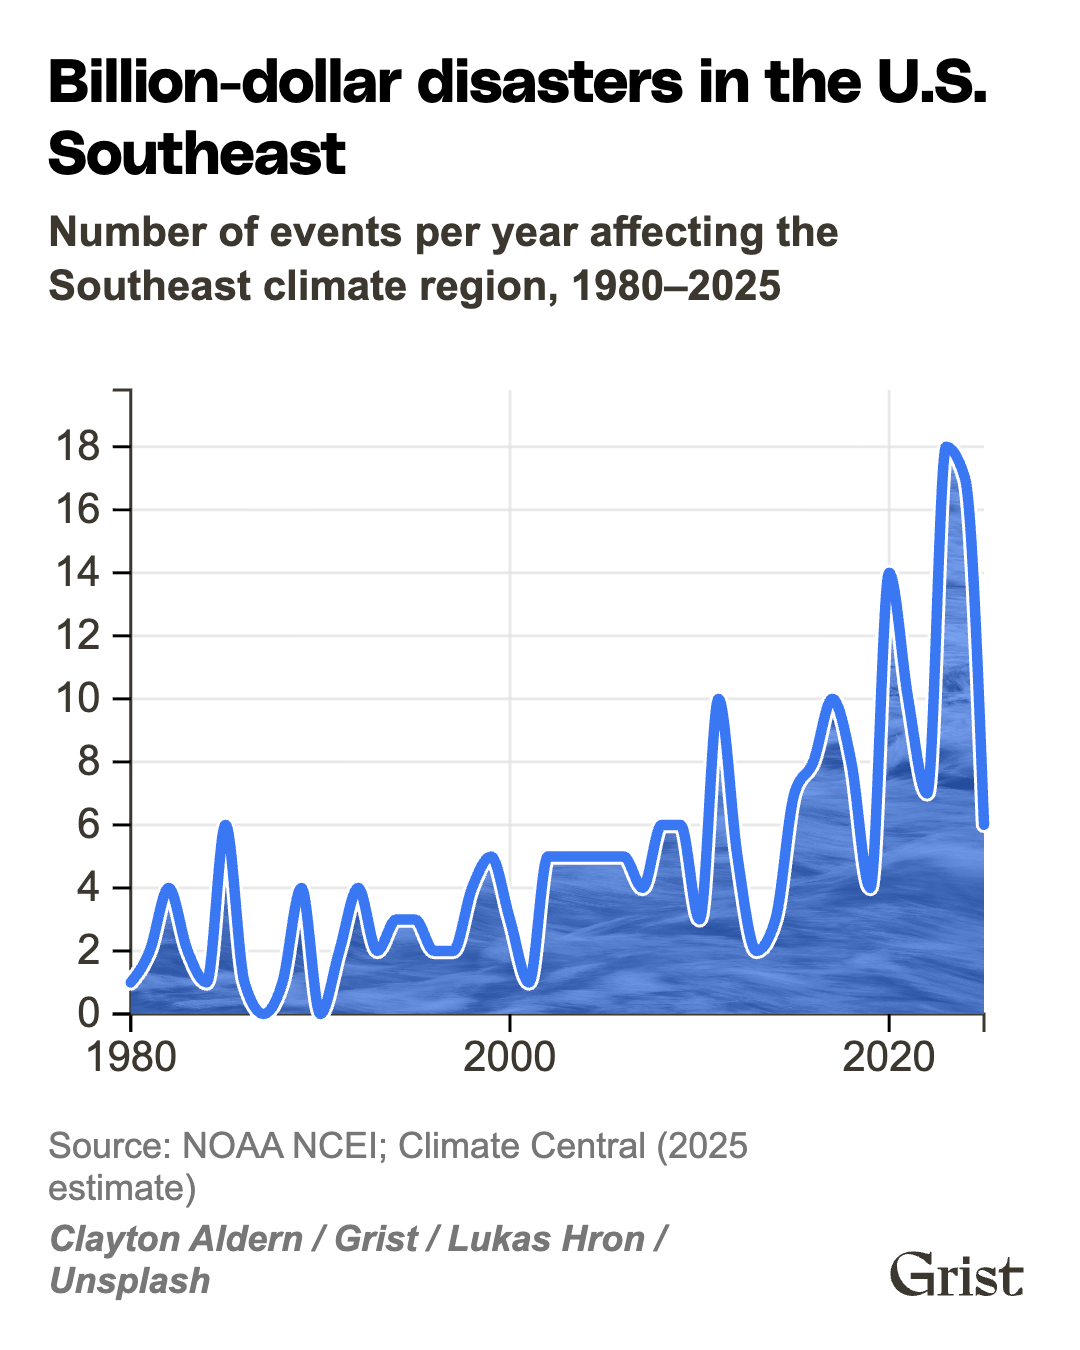
Billion-dollar disasters in the U.S. Southeast
Number of events per year affecting the Southeast climate region, 1980–2025
Some states in the region, such as Virginia, have also seen a major influx of data centers, which consume enormous amounts of electricity. In some areas, utilities are upgrading infrastructure to meet that demand, raising concerns that those costs could push electricity prices higher. However, a national study by Lawrence Berkeley National Laboratory found that an increase in demand in states between 2019 and 2024 actually led to lower electricity prices on average. That’s because when there’s more demand for power, the fixed costs of running a utility — such as maintaining the poles and wires that deliver electricity to your home — are spread out over a greater number of customers, leading to lower individual bills.
In Virginia, the world’s largest data center hub, electricity prices rose only modestly between May 2024 and May 2025, despite a rapid buildout of new facilities. But that dynamic could shift as hyperscalers construct ever-larger campuses. Ultimately, prices will hinge on how utilities and regulators choose to plan and pay for that demand.
For now, however, extreme weather remains one of the region’s main drivers of rising costs.
Southwest and Mountain West
(Arizona, Colorado, New Mexico, Nevada, Utah, Wyoming )
Key factor: Hotter summers
Arizona and New Mexico saw a nominal decrease in retail electricity prices between 2019 and 2024, after adjusting for overall inflation. However, there is a big difference between the states in how much residents pay for energy every month. Energy bills in New Mexico averaged just $90, while in Arizona they were nearly double at $160.
The main difference between the two states comes down to the fact that a greater share of Arizona residents are exposed to scorching summer temperatures — and therefore use more air conditioning, especially in population centers like Phoenix. (Average summer highs in Phoenix are about 20 degrees Fahrenheit higher than they are in Albuquerque, New Mexico’s largest city.) As a result, Arizonans use an additional 400 kWh every month, which leads to higher energy costs.
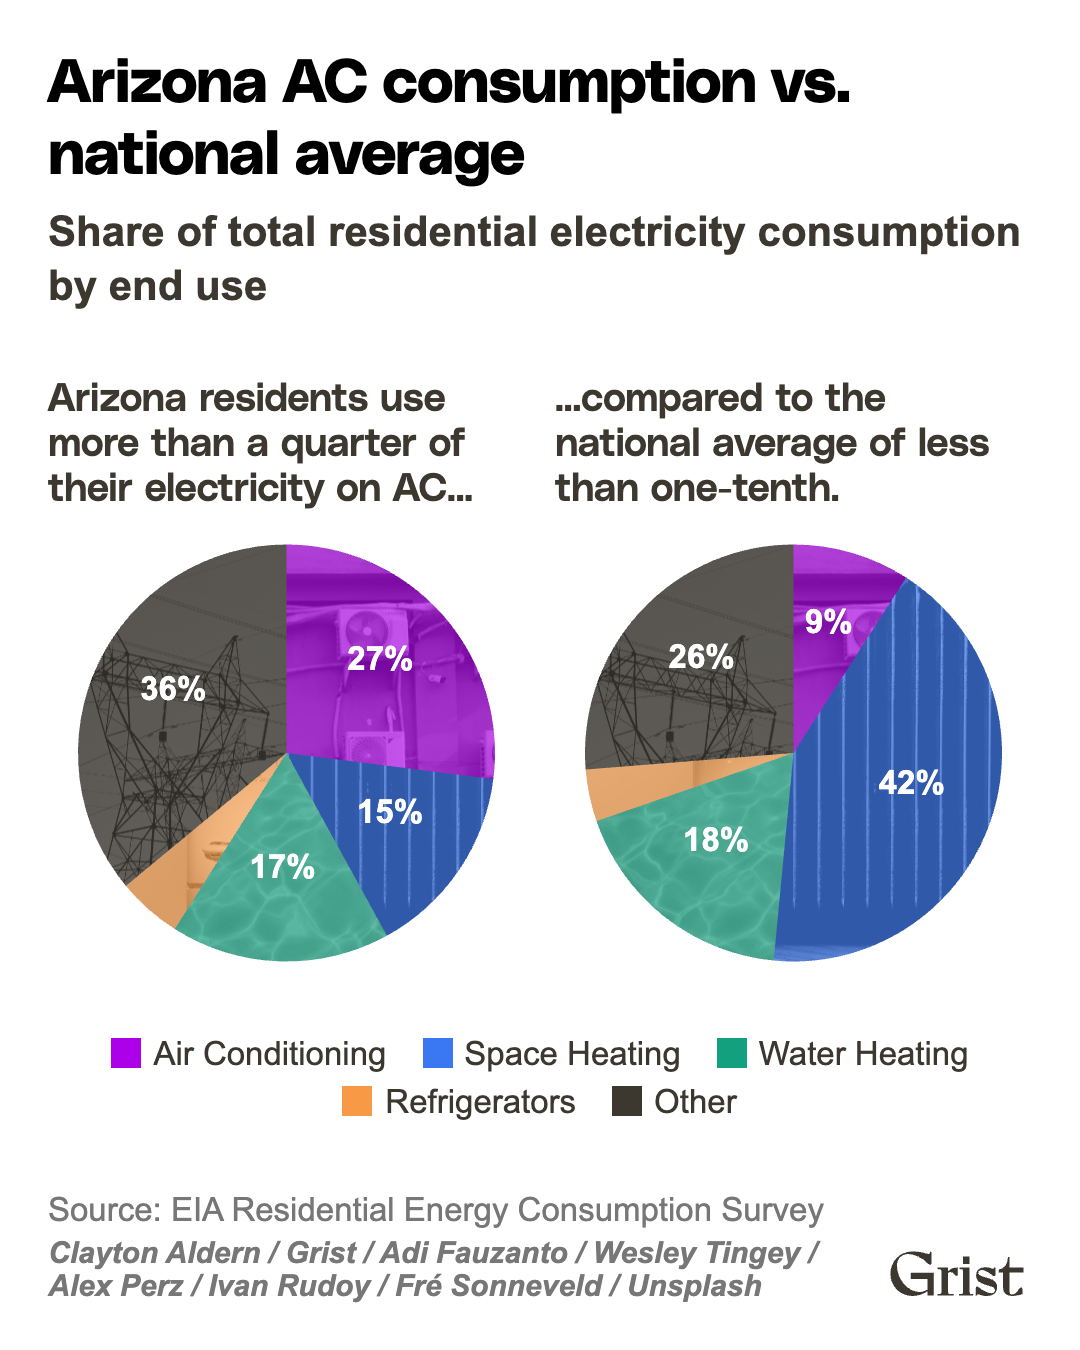
Arizona AC consumption vs. national average
Share of total residential electricity consumption by end use
Arizona residents could also see higher prices in the coming years as a result of rate cases that are being considered, which, if approved, will take effect in 2026. Both Arizona Public Service and Tucson Electric Power are asking the state to approve a 14 percent increase in rates, which could translate to an increase of about $200 in average household energy bills per year. Both utilities have justified the increase by citing the need to modernize the grid as well as higher costs of constructing and maintaining infrastructure.
Texas
Key factor: Regulatory free-for-all
Texas is a land of contrasts. Though it’s an oil-and-gas stronghold, the Lone Star State generates a significant share of its electricity from wind and solar. And unlike most states, it operates its own power grid and runs a deregulated electricity market in which electricity prices can swing sharply from hour to hour.
In Texas, local utilities compete to buy power from generators — natural gas plants, wind farms, and solar arrays among them — in a wholesale market, and then sell that energy to customers. The system gives consumers a lot of choice in picking utility providers, but it also allows utilities to pass on wild swings in the price of power generation. If the cost of natural gas skyrockets during a particularly cold winter when solar is less available, for instance, wholesale electricity prices jump with it. This can lead to eye-popping energy bills, like those seen during 2021’s Winter Storm Uri. The setup ultimately leaves consumers exposed to price shocks, especially when extreme weather hits.
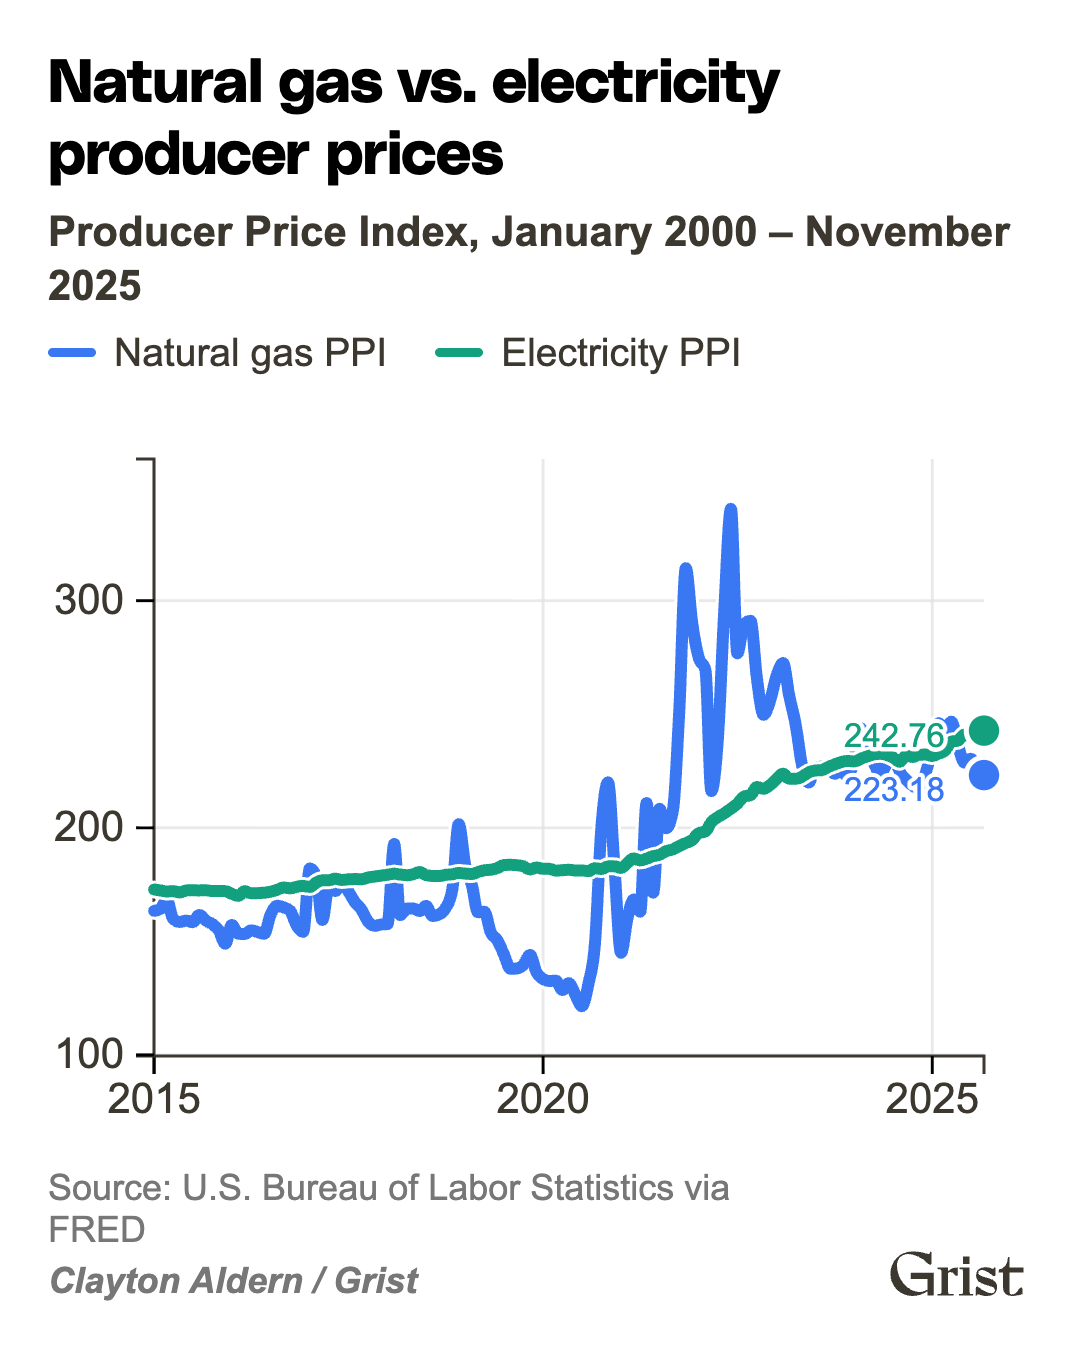
Natural gas vs. electricity producer prices
Producer Price Index, January 2000 – November 2025
Perhaps as a result, rising electricity costs in Texas are driven by the cost of delivering power — and in particular by swings in natural gas prices, since gas-fired power plants are the state’s primary providers when weather conditions don’t enable wind and solar. While average retail electricity prices fell by a little more than 5 percent between 2019 and 2024, Texans still pay some of the highest energy bills in the country, reflecting surging demand driven by population growth and industrial expansions as well as sharp price spikes during the state’s scorching summers and winter months.
As the state’s population grows, new data centers get built, and more renewable power is brought online, utilities are also having to invest heavily to expand the grid and harden it against extreme weather like Uri, during which at least 246 people died, mostly due to hypothermia. One analysis found that transmission costs grew from $1.5 billion in 2010 to over $5 billion in 2024 and could surpass $12 billion per year by 2033.
Anita Hofschneider contributed reporting to this piece.
This story was originally published by Grist with the headline What’s behind your eye-popping power bill? We broke it down, region by region. on Feb 18, 2026.
This content originally appeared on Grist and was authored by Naveena Sadasivam.