This content originally appeared on HackerNoon and was authored by Image Recognition
Table of Links
Materials and Methods
2.1 Vector Database and Indexing
Discussion
4.1 Dataset and 4.2 Re-ranking
4.4 Volume-based, Region-based and Localized Retrieval and 4.5 Localization-ratio
4.4 Volume-based, Region-based and Localized Retrieval
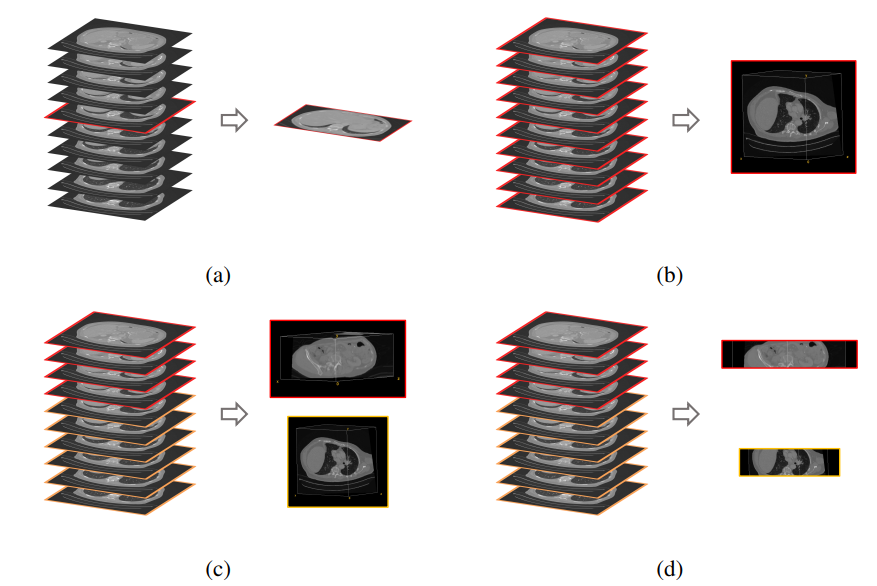
Since multiple organs (i.e. labels) are present in each query volume, there are essentially different ways in which image retrieval can be performed. The preferred choice depends on the context of the retrieval task in the real world. If the goal is to find a scan out of a database that is most similar to a complete query scan with the entirety of all present organs (think scan-id to scan-id but visual), then volume-based retrieval is the right choice. In contrast, if the experimenter is interested in a particular organ and its most similar counterpart in the database (and all other organs just happen to be in the same scan due to proximity), then region-based retrieval or localized retrieval is advised. Slice-wise retrieval can find the most similar slice of a volume regardless of the number of other slices. This is not usually a practical choice in real scenarios. Figure 11 visualizes the options.
4.5 Localization-ratio
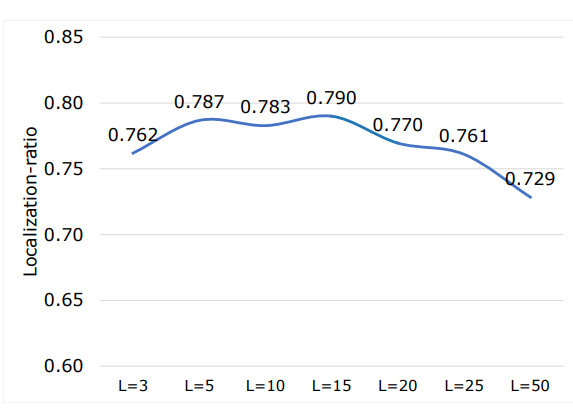
Table 22 shows the average localization-ratio for with and without re-ranking (L = 15). There is a drop for both 29 coarse and 104 original TS classes after re-ranking. However, both with and without re-ranking the localization-ratio is high, indicating that most of the slices contributing to the final retrieval of the volumes actually contain the desired anatomical region. However, based on (7) the choice of L can impact this measure. Figure 12 shows localization-ratio for different values of L as shown increasing the L to more that L = 15 decreases the localization-ratio. This indicates
\

\

\

\

\

\ that the first highest values in vector mSIM based on (6) points to the exact slices that contain the desired anatomical structure. To improve the re-ranking localization-ratio, further studies can focus on optimizing the L value based on heuristic, organ size, etc.
\
:::info Authors:
(1) Farnaz Khun Jush, Bayer AG, Berlin, Germany (farnaz.khunjush@bayer.com);
(2) Steffen Vogler, Bayer AG, Berlin, Germany (steffen.vogler@bayer.com);
(3) Tuan Truong, Bayer AG, Berlin, Germany (tuan.truong@bayer.com);
(4) Matthias Lenga, Bayer AG, Berlin, Germany (matthias.lenga@bayer.com).
:::
:::info This paper is available on arxiv under CC BY 4.0 DEED license.
:::
\
This content originally appeared on HackerNoon and was authored by Image Recognition