This content originally appeared on DEV Community and was authored by Andy Jiang
Too often, we’re presented with logs like this:
[http] GET /api/book/1
[http] GET /api/book/2
[db] SELECT * FROM books WHERE id = 1
[db] SELECT * FROM books WHERE id = 2
error: Uncaught (in promise) PostgresError: 'name' column is null
  throw new PostgresError(`'name' column is null`);

    at query (file:///tmp/main.ts:29:9)
    at queryBook (file:///tmp/main.ts:25:3)
    at handleRequest (file:///tmp/main.ts:21:3)
    at file:///tmp/main.ts:18:1
So, does book 1 or book 2 have a null name field? 
Without context, these logs are noisy and difficult to parse. However, if we associate a request ID with each log, then we can determine which book had the null name field:
[req:1] [http] GET /api/book/1
[req:2] [http] GET /api/book/2
[req:1] [db] SELECT * FROM books WHERE id = 1
[req:2] [db] SELECT * FROM books WHERE id = 2
[req:1] error: Uncaught (in promise) PostgresError: 'name' column is null
  throw new PostgresError(`'name' column is null`);

    at query (file:///tmp/main.ts:29:9)
    at queryBook (file:///tmp/main.ts:25:3)
    at handleRequest (file:///tmp/main.ts:21:3)
    at file:///tmp/main.ts:18:1
Now, we’re able to immediately understand the problem causing the error. Book 1 is missing a name!
We could manually pass a dynamically generated requestId across our functions so that they’re included in each console.log:
// Express app

export async function handle(req: Request): Promise<Response> {
  const requestId = Math.random();

  console.log(`[req:${requestId}] [http] ${req.method} ${req.url}`);

  const url = new URL(req.url);
  const bookId = url.pathname.split("/")[2];
  const data = await getData(requestId, bookId);

  return Response.json(data);
}

async function getData(requestId: number, bookId: string): Promise<Book> {
  console.log(`[req:${requestId}] [db] get book ${bookId}`);
  try {
    return await db.selectFrom("books").where("id", "=", bookId).first();
  } catch (err) {
    console.error(`[req:${requestId}] ${err}`);
    throw err;
  }
}
But that is annoying and difficult to scale/maintain.
Instead, running the program with Deno (and it’s built-in OpenTelemetry support) will automatically apply unique request IDs to each log:
$ deno run -A --unstable-otel app.js
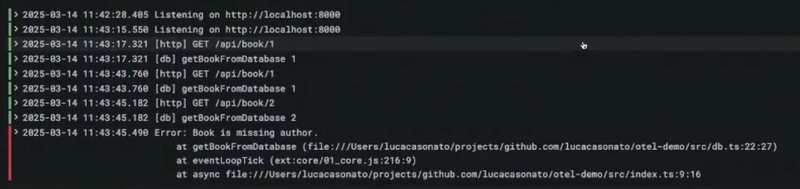
And in our Grafana Loki, we can see that while our logs don’t include the request ID in the logs themselves:
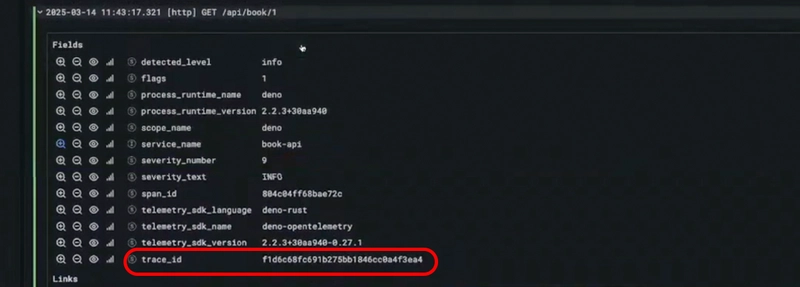
Clicking on a single log will show us a trace_id:
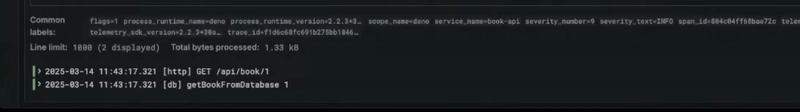
And when we click on the trace_id, we will see all the logs associated with that specific request:
Now it is much easier to parse the logs and know how to identify problems in our code.
Watch the full 20 minute talk on zero config debugging with Deno and OpenTelemetry.
Learn more about getting deep traces in Node.js with Deno, OpenTelemetry support in Deno, and Deno v2.2.
This content originally appeared on DEV Community and was authored by Andy Jiang